
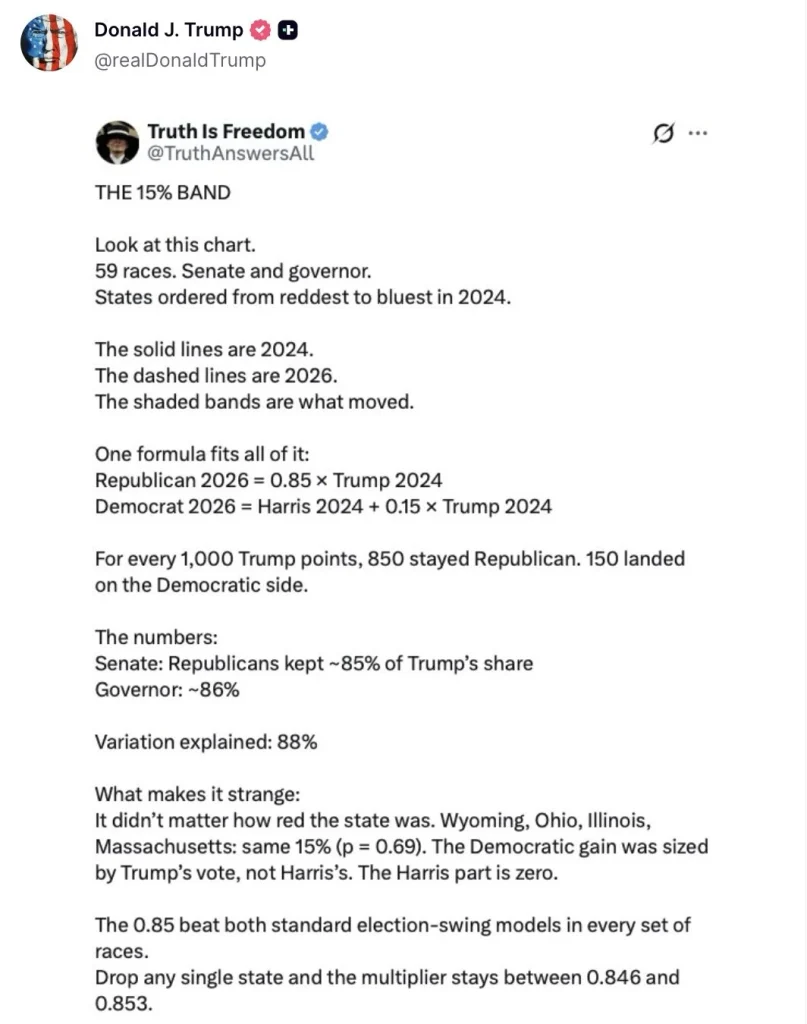
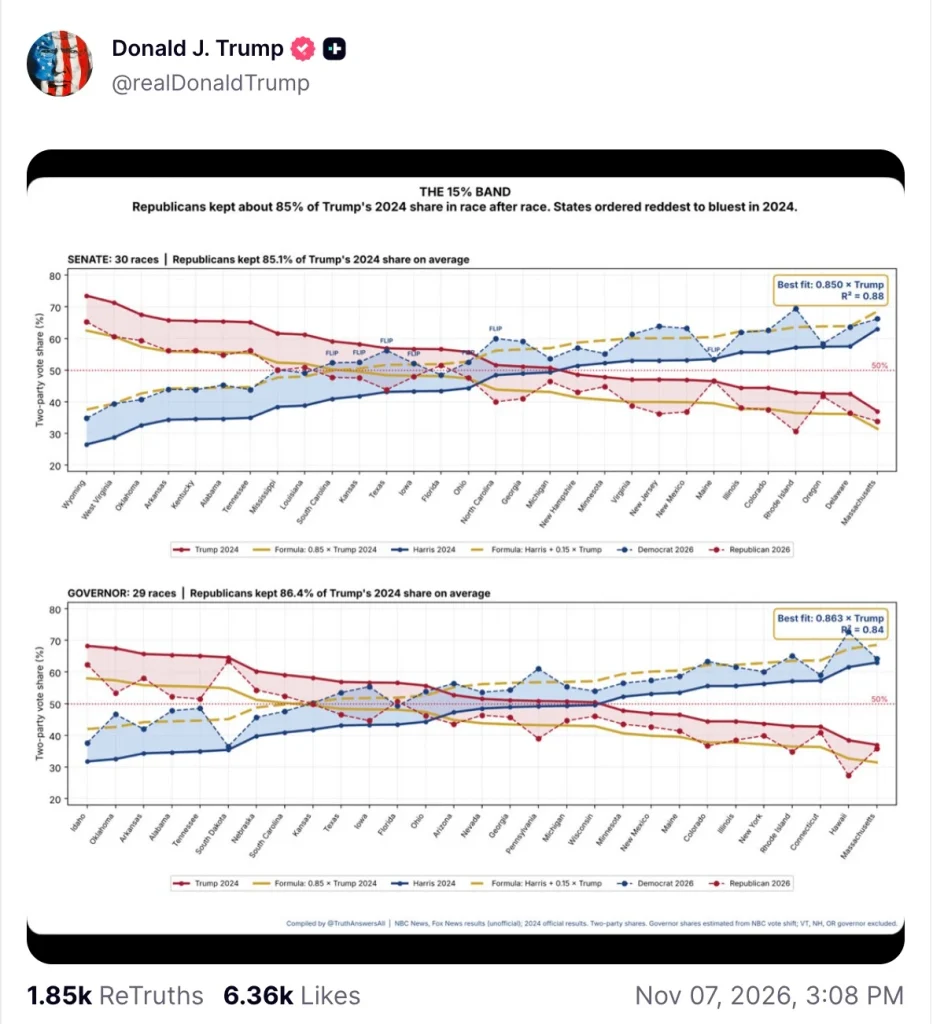
The post examined 59 Senate and gubernatorial races, comparing the 2026 election results with the state’s voting patterns during the 2024 presidential contest between Trump and then-Vice President Kamala Harris.
What the analysis claims to have uncovered is a remarkably consistent relationship between the two elections.
Rather than showing the wide variations typically associated with midterm elections, the results allegedly followed a mathematical formula that appeared repeatedly across different states and political races.

According to the analysis, the proposed calculation is straightforward:
Republican 2026 vote share = 0.85 × Trump’s 2024 vote share
Democrat 2026 vote share = Harris’s 2024 vote share + 0.15 × Trump’s 2024 vote share
Put another way, the theory suggests that for every 1,000 percentage-point-equivalent votes associated with Trump’s 2024 performance, approximately 850 carried over to the Republican candidate, while the remaining 150 effectively appeared on the Democratic side of the ledger.
The reported figures show Republicans retaining approximately 85 percent of Trump’s previous vote share in Senate contests and 86 percent in gubernatorial races.
Even more striking, the model reportedly accounts for 88 percent of the variation across the elections examined.
Those numbers have fueled speculation among election observers who believe the pattern deserves closer examination.
A Pattern That Allegedly Crossed State Lines
Perhaps the most provocative aspect of the analysis is its claim that the same relationship appeared regardless of a state’s political leanings.
Deep-red Wyoming, traditionally competitive Ohio, and heavily Democratic Illinois and Massachusetts were reportedly included in the comparison.
According to the post, the estimated Democratic gain remained remarkably close to the same 15 percent figure across these vastly different political environments.
The analysis reported a p-value of 0.69 for the consistency of the pattern.
The researchers also emphasized that the apparent Democratic gain was calculated using Trump’s 2024 vote share rather than Harris’s previous total.
Another detail highlighted in the post concerns what happened when individual states were removed from the calculations.
According to the analysis, excluding any one state barely changed the results. The estimated multiplier reportedly remained within a narrow range of 0.846 to 0.853.
That stability is central to the argument being advanced by the account.
The analysis further claims that its 0.85 multiplier performed better than conventional election-swing models across every group of races examined.
Of course, a statistical relationship does not independently establish that election fraud occurred. Differences in turnout, voter participation, candidate quality, and changes in political preferences can all influence election results. Nevertheless, the unusually consistent relationship described in the post has prompted calls for a closer examination of the underlying numbers.
Why Several Republican Strongholds Allegedly Fell
The theory also offers an explanation for why several states that supported Trump in 2024 reportedly produced Democratic victories in 2026.
Under the proposed formula, a Republican candidate would need to start with approximately 58.8 percent of the vote in Trump’s 2024 state-level results to maintain a projected share above 50 percent after the alleged 15 percent reduction.
States falling below that threshold would theoretically become vulnerable to Democratic victories.
The analysis identified Texas, Kansas, Iowa, Ohio, South Carolina, and North Carolina as states that fell below the projected cutoff.
According to the post, all six subsequently flipped.
That is one of the central arguments behind the 85/15 theory: the same mathematical relationship allegedly appeared in two different categories of races, involving different candidates, campaign organizations, and political environments.
Ordinarily, midterm elections produce considerable variation. Local controversies, candidate strengths, campaign spending, voter enthusiasm, and national political developments can produce very different outcomes from one state to another.
The theory’s proponents argue that the apparent consistency across these contests is precisely what makes the findings worthy of scrutiny.
Whether the pattern reflects an underlying electoral trend, an unusual statistical relationship, or something more troubling remains a question requiring independent examination of the complete election data.
A Controversial Reminder of the 2020 Election
The latest controversy also brings back memories of another election analysis previously highlighted by The Gateway Pundit.
In November 2020, the outlet published an investigation into what it described as a suspicious ballot-counting phenomenon known as the “Drop and Roll” pattern.
That analysis focused on large batches of ballots reported during the overnight counting process in several battleground states. It alleged that subsequent ballot releases repeatedly produced voting ratios that heavily favored Joe Biden over Donald Trump.
The Gateway Pundit argued that the recurring numerical patterns deserved further investigation, particularly given their potential impact on the final outcomes in closely contested states.
The original report was published on November 18, 2020, and its accompanying video subsequently attracted millions of views.
However, claims surrounding the 2020 election have been heavily disputed, and no established finding from the material presented here demonstrates that the alleged ballot pattern proves fraud.
Now, six years later, the emergence of the 85/15 theory has revived familiar questions among voters who remain skeptical about election administration and the reliability of reported results.
Trump’s decision to amplify the latest analysis ensures that the discussion will receive additional attention, particularly among Republicans seeking answers after the disappointing 2026 midterm results.
Ultimately, the most important next step is independent verification. The underlying state-by-state vote totals, methodology, statistical assumptions, and comparisons must be examined carefully before any conclusions can be justified.
If the reported pattern holds up under rigorous scrutiny, it could offer an interesting explanation for the unusual similarities between these election results. If it does not, the public deserves to know that as well.
One thing is certain: Trump’s amplification of the 85/15 analysis has put another contentious election-related debate squarely in the national spotlight.

