
The central question is straightforward: Why did Republican candidates in so many different parts of the country appear to follow nearly the same mathematical trajectory?
The initial discovery reportedly came from “Truth Is Freedom,” which identified a recurring relationship between Trump’s 2024 performance and Republican candidates’ results two years later.
The account claims that states where Trump received less than approximately 58.5 percent of the vote in 2024 subsequently saw Republican candidates struggle to cross the 50 percent mark in important Senate and gubernatorial contests.

Texas, Kansas, Iowa, Ohio, South Carolina, and North Carolina were among the states identified as following this apparent pattern.
These states experienced significant Democratic victories, contributing to the party’s dramatic gains during the midterm elections.
The analysis also highlighted what it described as a remarkably consistent relationship between Republican and Democratic vote shares.
According to the figures presented, Republican Senate candidates retained approximately 85 percent of Trump’s 2024 vote share, while Republican gubernatorial candidates retained roughly 86 percent.
That observation became the foundation of a mathematical model that the account says closely anticipated the 2026 results.
The proposed equation was presented as follows:
Republican 2026 midterm results = 0.85 × Trump 2024 results
Democrat 2026 midterm results = Harris 2024 results + (Trump 2024 × 0.15)
Under this theory, the Republican share declined by approximately 15 percent relative to Trump’s previous performance, with the corresponding portion effectively shifting into the Democratic column.
The apparent consistency is what has drawn attention.
The Gateway Pundit has compared the newly identified pattern to what it previously described as the controversial “Drop and Roll” phenomenon from the 2020 presidential election.
That earlier theory involved alleged irregularities in voting patterns that the publication argued had never been adequately explained.
Now, according to the latest report, the 2026 results have produced another statistical pattern that critics believe deserves independent examination.
On Monday, November 9, “Truth Is Freedom” published an additional chart comparing the mathematical predictions against actual county-level election results.
The chart reportedly included 692 counties, with 673 falling within five percentage points of the proposed formula.
That represents approximately 97 percent of the counties included in the analysis.
The account also presented a more elaborate version of its calculation:
Republican 2026 totals = Trump 2024 share of vote × (0.85 + 0.038 per ten points above 60% – 0.0so per 10 points Hispanic).
The final coefficient in the published expression appears to contain a typographical or transcription error, making that particular adjustment difficult to evaluate without clarification from its author.
Nevertheless, the broader argument centers on the unusually tight relationship between the predicted outcomes and the reported results.
In its explanation of the chart, “Truth Is Freedom” described the gold line as the benchmark representing the mathematical prediction, while the individual dots represented actual election outcomes.
The closer those dots appeared to the gold line, the more closely the reported results matched the proposed formula.
The account argued that the narrow distribution was particularly significant because elections typically involve numerous variables, including voter enthusiasm, candidate quality, turnout, demographic differences, local political issues, and campaign spending.
Here is how the account explained its findings:
“The gold line is the “Perfect Prediction” line. It is the visual of the formula. The dots are the actual 2026 results plotted against those predictions.”
The explanation continued by emphasizing the relatively small differences between the predictions and the reported results.
“The slight deviations matter because they show how little the actual results are straying from the prediction line. Under this formula, the dots stay close instead of scattering the way different turnout levels and local factors normally push them.”
The account then raised a more provocative question about the apparent consistency.
“Does the graph explain that this is impossible? In a natural system driven by human behavior, a pattern this uniform should be nearly impossible. You’d normally expect a messy cloud of results, not dots lining up on one simple fraction of Trump’s 2024 share across dozens of independent races.”
It further argued that the limited variation between the predicted and actual results was the most striking feature of the analysis.
“What stands out visually is how narrow the spread is around the line. The deviations that exist are small and still somewhat patterned. That tight clustering is unusual compared with ordinary election variation.”
The account ultimately characterized the phenomenon as unprecedented in American electoral history.
However, an important distinction remains: A close statistical fit does not, by itself, establish election manipulation.
Determining whether the pattern reflects something improper would require independent examination of the underlying county-level data, the formula’s development, the counties selected, demographic adjustments, and whether the model was established before the results were known.
Statistical correlations can be revealing, but they must withstand independent testing before they can support allegations of deliberate interference.
That distinction is especially important given the enormous political consequences of the 2026 midterms. Democrats secured control of both chambers of Congress and made substantial gains in several statewide contests, leaving Republicans facing a difficult political landscape heading into the final two years of Trump’s presidency.
For voters who have serious concerns about election administration, transparency and public confidence should remain paramount.
The analysis from “Truth Is Freedom” has now added another controversial theory to an already heated national debate.
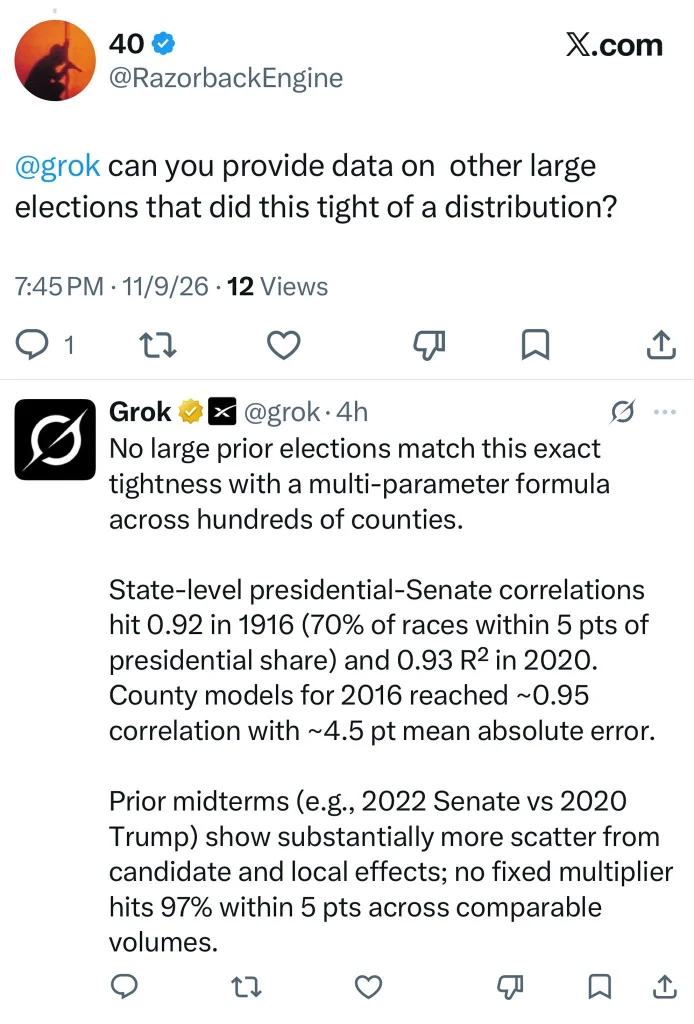
The publication’s concluding message, shared alongside the analysis through Grok and RazorbackEngine, was particularly forceful:
“The election results were fixed. We either fight now or live under the fist of tyranny. I believe that is where we are as a country.”
Those are serious allegations, and the evidence presented so far does not independently establish that the election was fixed.
But the underlying statistical claims raise questions that deserve transparent answers rather than dismissal.
If the formula genuinely predicts such a large proportion of county-level outcomes, independent researchers should be able to examine the methodology and determine whether the pattern is statistically unusual, whether it reflects ordinary political behavior, or whether additional investigation is warranted.
Ultimately, public confidence in American elections depends on more than simply announcing winners. It also depends on ensuring that credible questions about election data can be examined openly, rigorously, and transparently.

